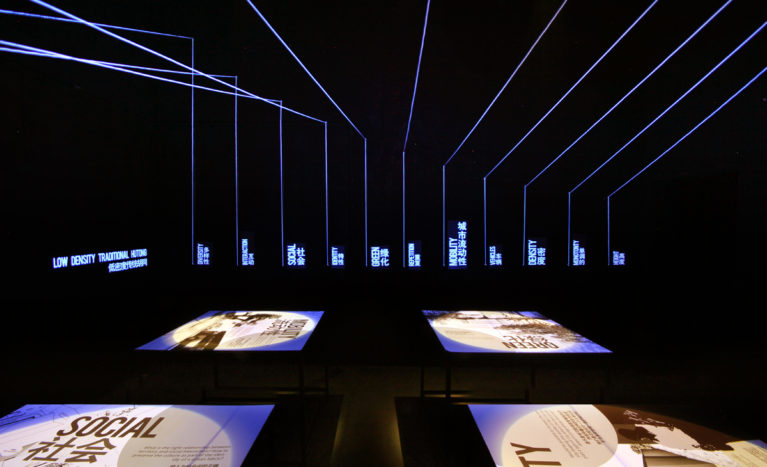

the low density wall chart
The exhibition shows an infographic with the characteristics of low-density neighbourhoods. A bar chart represents the values of mobility, urban greenery or social diversity among others. These parameters are diametrically opposed to those in the dense city model, so the union of both graphs generates a hyperbolic paraboloid on the ceiling.
3/12